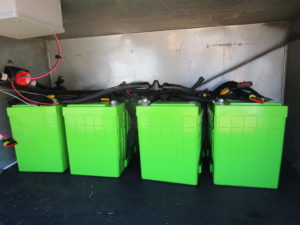
John found our four Valence lithium batteries on eBay. They were previously used in an electric truck and they were a super good deal, assuming there is some decent amount of life left in them. With 138 amp-hour capacity (when new) and at $489 each, if they are any good at all then we should be set for a while. Battery prices are continuing to drop, but for quick reference today I see a new 100 amp-hour Battleborn is $949.
Our battery bank, installed in the “no more generator to see here!” compartment of Howie:
So the key question was “are they actually any good at all?” or perhaps we would be looking at a replacement purchase in the near future if not.
John suggested we should run a test of actual battery capacity. This would give us the data we needed for the capacity setting on our meter and a sense of the condition of the batteries.
[Warning – this post is full of numbers and graphs, so it could be super interesting to some of you and completely boring to others]
To run this test, we would start with fully charged batteries and then apply a constant load until they were almost depleted. Battery curves are helpful in figuring out how that might go.
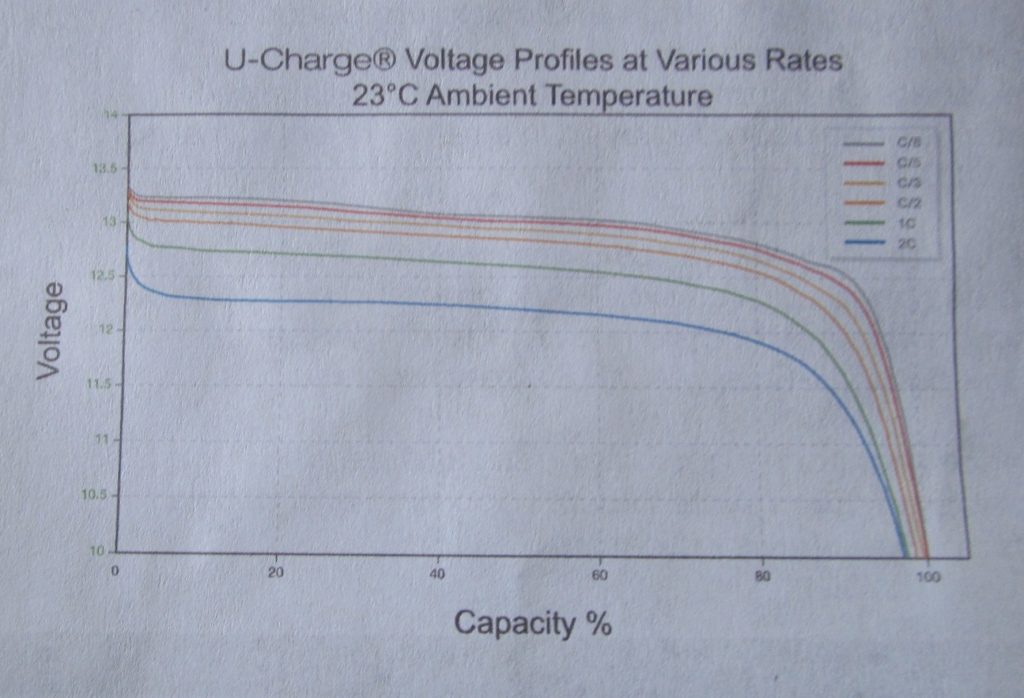
Here is the voltage profile as the battery power is being drained. “Capacity %” seems backwards to me, with 0% being completely full and 100% completely drained, or maybe they mean capacity to add more back in (I didn’t make this curve, it came with the documentation). But you get the idea. The different colors are for different rates of discharge, and I’ll explain the term “C” in the paragraph below. Pulling a whole bunch of energy at a time (the blue curve) results in a lower voltage and a bit quicker tail at the end, so we set up the test to avoid doing that:
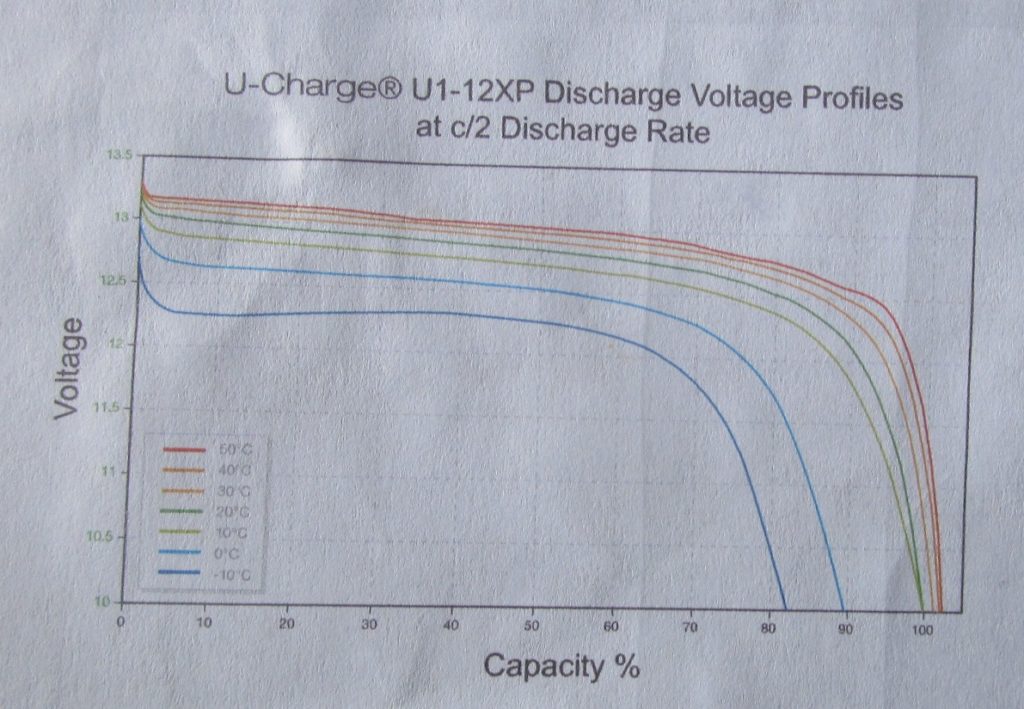
Another curve shows the effect of low temperature on the battery performance. The blue curve is at -10 degrees Celsius (14 deg F), a definite degradation. For our test we would be in the green area, around 15 deg C (60 deg F).
The “C-rate” is how fast the discharge speed compares to the battery’s maximum capacity. 1C means the battery will be entirely drained in one hour. C/2 is half of that rate and 2C is twice that rate.
For our test we were aiming for C/2 or less in order to be in the bunched-up parts of the curves. That shouldn’t be difficult, because we have limitations on how much current we can draw at any one time. Each circuit in our trailer is limited to 15 amps, with a maximum of 30 amps in total, which is 3600 watts for the 120 volt AC side of the system.
Let’s convert to watts to make things easier, instead of trying to figure out equivalent amperage for our 12 volt batteries that are connected up for 24 volt DC and then inverted to get 120 volt AC. Good luck trying to sort all that out. We tried, it was a mess.
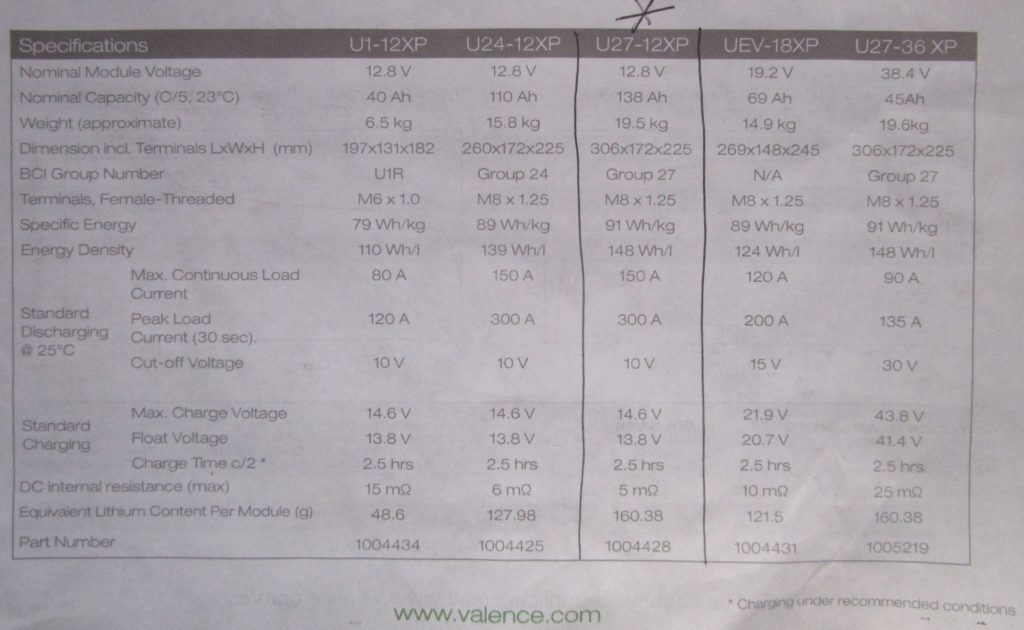
Here is the spec sheet for the batteries (U27-12XP):
In wattage terms, each battery when new had the capacity for 12.8 volts x 138 amp-hours = 1760 watt-hours. Four of them in total would be about 7000 watt-hours, so that should be the basis for our “C” numbers. C/2 = 3500 watts and that’s also about the maximum our trailer circuits can handle.
Our test plan involved turning on appliances to hit around 2000 watts of power draw (C/3.5). Much less than 2000 watts and the test would take a lot longer. We were looking at about 3 hours to reach the low end of the battery capacity, while drawing energy at a decent but not ridiculously fast rate.
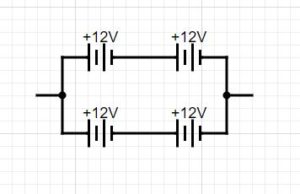
The “7000 watt-hours” number also gives us something to compare to and aim at (without hitting). We prefer not to drain our batteries completely because we don’t have an overall battery management system (BMS), only individual BMS’s for each battery. When the voltage drops below a certain point, each BMS will stop allowing for energy draw from that battery. The question for us is what would happen if one battery in the set turned off, when we have 2 parallel strings of 2 batteries in serial … and we didn’t want to find out, in case it was something bad. Is there an electrical engineer in the house who might be able to answer that?
The good thing about lithium batteries is that you can routinely discharge them almost completely without adversely affecting their lifetime, so the capacity is almost all useable. I described this in the previous post about switching from lead-acid to lithium batteries.
The above voltage curves show that when each battery drops below 12 volts, it is at the steep dive-over-the-edge point at the right side of the graph, somewhere around 95% used / 5% remaining. Our battery bank wiring results in a 25.6-volt nominal output, so we were looking for the voltage to drop below 23-24 volts at the end of the test. Then we could figure out how much energy was actually used and compare that to the 7000 watt-hour target for new batteries.
OK, that’s the setup, now let’s get on with the actual test already!
External temperature = 58 degrees F (14 deg C) at the start
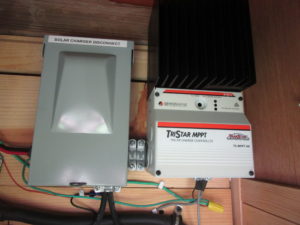
We pulled the disconnect to the incoming solar so there would be no confounding data during the test. The left box contains the solar disco, and I can imagine a “solar disco” in a different/celestial sense that might be completely awesome and very scary, but for now it’s just a basic part of our electrical system.
The battery level was full from charging up with incoming solar that morning. The voltage read 29.2 volts and the batteries were not accepting additional current. We disconnected shore power completely so it was also no longer part of the system for this test.
We have a Bogart meter that tracks cumulative energy usage over time, so we recorded that piece of data at the start of the test = 683 amp-hours.
With almost-zero load (everything turned off in the trailer) the meter showed 9 watts coming from the batteries. Basically nothing except the meter display and perhaps other tiny items.
Turning on the fridge added a small load, 70 watts total.
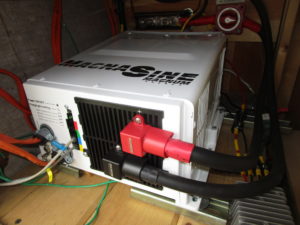
We unplugged all devices that might use energy intermittently, like the laptops, phones, electric toothbrush. Then it was time to turn on the inverter so we could get serious with the energy draw. The inverter, ready to go to work:
The draw with the inverter on (including the DC fridge but without any major AC loads) = 100 watts total
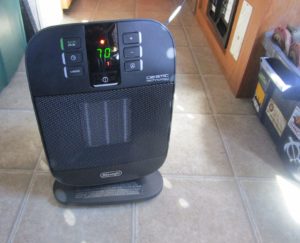
The appliance of largest significance was the ceramic heater. I started the clock for the test when we turned it on:
With the heater on low the load was 1050-1060 watts, then we bumped it up to high for 1630 watts in total.
There was room for a bit more draw, so we turned on the mini heater:
Now we had a constant load of 1850 watts, per the Bogart meter. Good enough! The readings at the beginning were 25.6 volts, 72.5 amps, 1850 watts, and 100% full.
Time to collect some data and then set a timer for ~30 minute intervals to gather a few data points along the way. We had plenty of heat going so we were certainly warm enough while waiting. I might have even needed to open the windows…
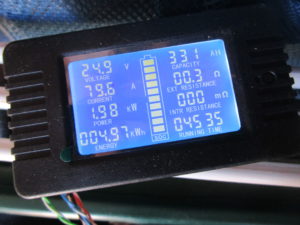
John had wired up a battery meter so we could get some additional measurements and compare them to our other meters. I monitored the meter during the test and collected the data in the left-hand column: Voltage, current, power, and total energy drawn since the test started. This is the data labeled “Meter” in the below graphs. Here we have almost reached 5 kWh and the voltage is still over 24V, excellent!
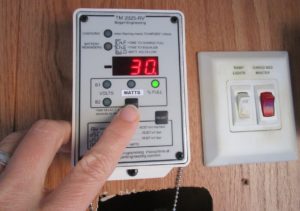
The Bogart meter is connected to the shunt and it’s what we normally use to monitor the batteries. The “% full” parameter is based on a maximum that we set manually. John had guessed at 270 amp-hours before we ran the test, and we planned to adjust it based on the results as needed.
Here the Bogart meter shows that we are at about 30% remaining:
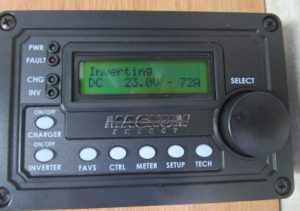
The inverter also has a display showing the AC power being drawn, so I collected this data as well. Here it is at the end of the test when all of the voltage readings were starting to drop. 23 volts, time to end the test:
The external temperature at the end of the test = 62 degrees F (17 deg C)
Since it was nearing the end of the day, we used the Magnum inverter/charger to charge the batteries back to about 70% using shore power. It’s nice having that option, especially since the refrigerator runs off the batteries, and we like it when the fridge has power overnight.
OK, so what did we learn?
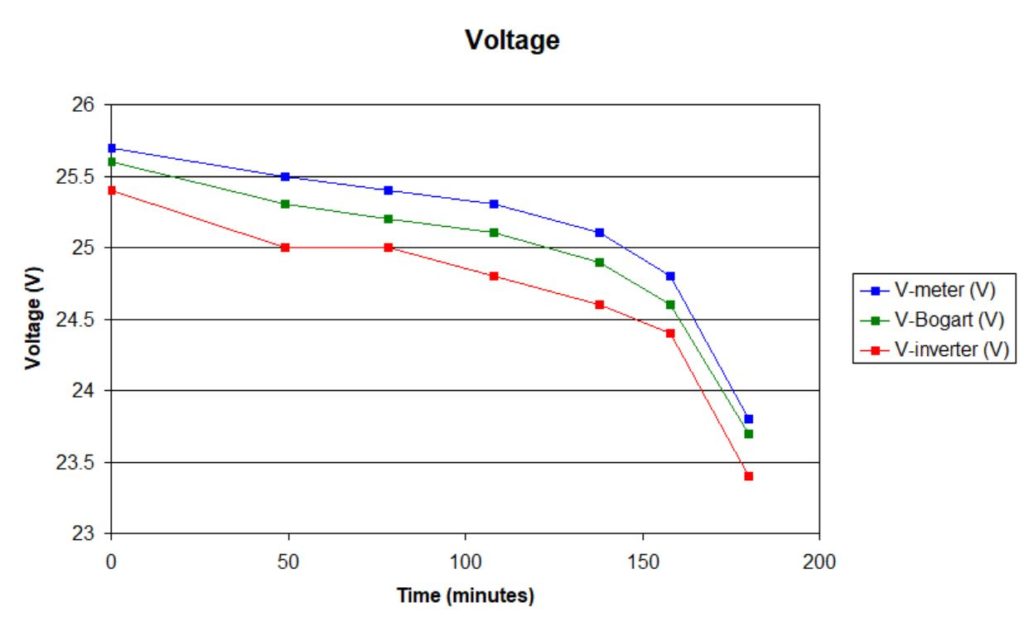
First, here are the graphs for the data I collected while the test was running.
Side note – I tried a couple different charting programs but didn’t find anything obviously better than an Excel scatter plot. If anyone has other suggestions for programs to try, please send them over.
The voltage curve looks a lot like the one at the top of the post, yes? There is a slight offset depending on where each meter is reading within the circuit, but the shapes all line up, and I think this is pretty cool:
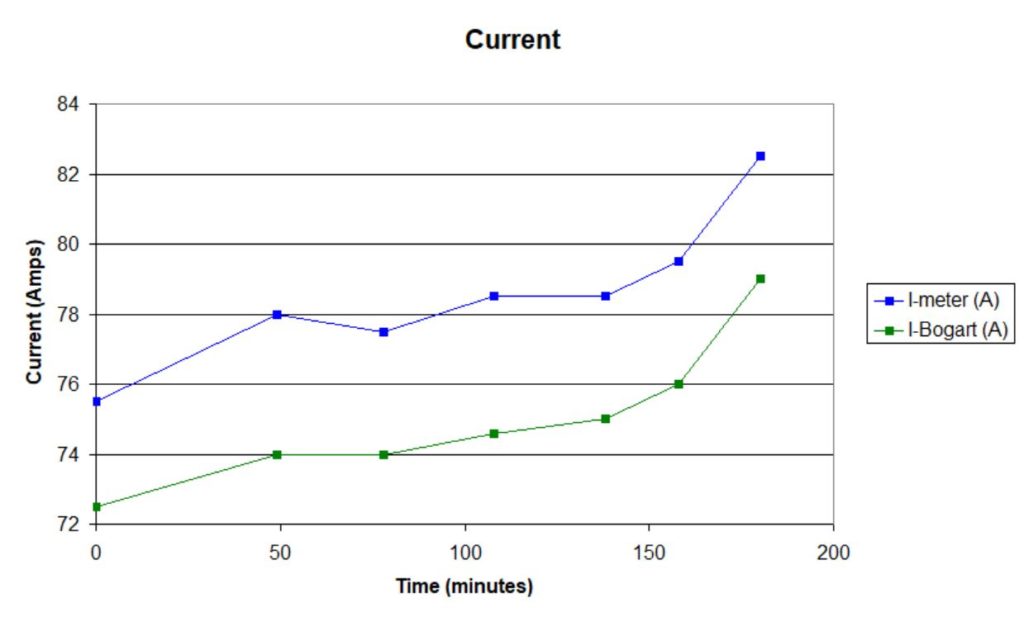
The power output remained constant throughout the test, so as the voltage dropped the current needed to rise (power = voltage x current):
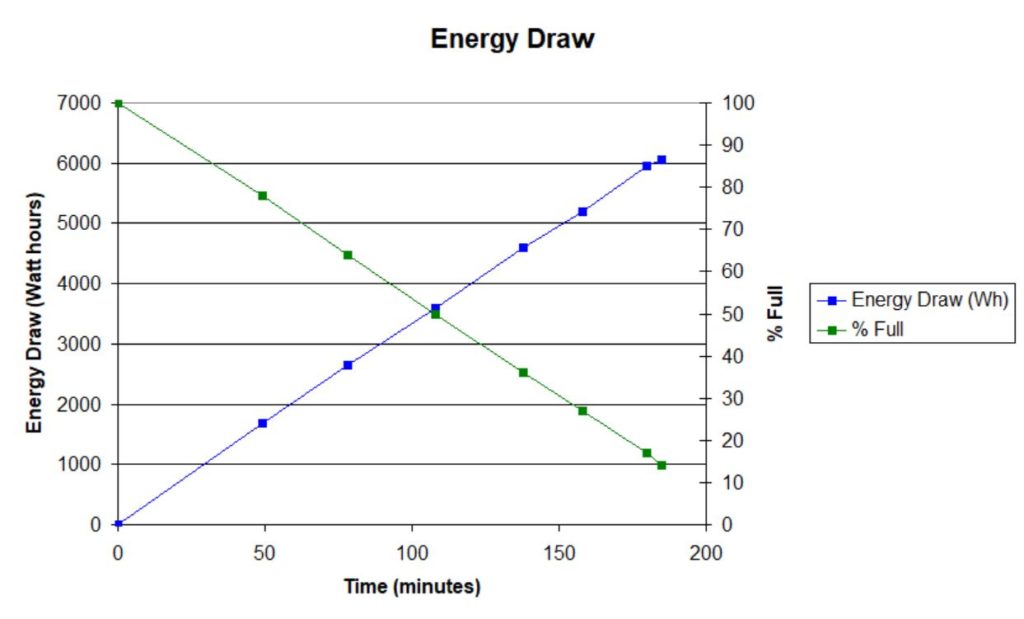
The energy draw (watt-hours used) and the corresponding drop in battery level:
And finally, the main purpose of the test was to determine the capacity of the batteries. So we need to calculate how much energy was consumed during the test plus how close we got to emptying the batteries completely.
Energy consumption can be calculated in several ways:
a) The battery meter displayed a cumulative energy reading of 6060 watt-hours
b) The Bogart meter showed a cumulative amp-hour end point at 914 Ah, for a delta of (914-683) = 231 amp-hours. Average voltage during the test was around 25.1 volts, for ~5800 watt-hours
c) The loads pulled about 1900-2000 watts for 3.1 hours, or approximately 5890-6200 watt-hours
Happily all of these numbers are reasonably similar. I’m calling it 5800-6000 watt-hours used during the test.
How close did we get to the bottom of the battery barrel? Looking at the voltage profiles from the beginning of this post, I cross-referenced for a temperature of 15 degrees Celsius and a discharge rate of C/3.5. The voltage reached a low point of about 23.6 volts, which is equivalent to about 11.8 volts for an individual battery (John had previously tested the individual batteries and shown that they are well matched). With some squinting and eyeballing, I come up with a number of about 92% used.
~5800 to 6000 watt-hours divided by 92% = 6300 to 6500 watt-hours of full capacity
Compared to a spec of 7000 watt-hours for new versions of these batteries, that’s pretty good! We are quite happy about that, and hopeful that they will last for a while.
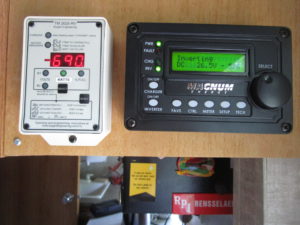
On a mostly unrelated note, here are the meters after John replaced the mounting wall so we no longer have holes to try to photograph around. Thank you John! In this instance, we’ve got some kind of AC load turned on (perhaps the water heater) and it is being partially offset by incoming solar:
In summary, now we know how much energy we can store in the batteries and use every day, and we aim to keep from going below 20% full. We try to run everything off the batteries + solar, but we currently have full hook-ups so we can supplement with shore power when we need to. By summertime we’ll be ready for extended boondocking.
We’re still learning, and it’s still interesting to report about it (and I’ve got plenty more to say!) Thank you for following along!

Excellent Report. Thanks. Why would the Magnum 4K Inverter/Charger use 100W of power with no AC loads? That doesn’t seem right. I looked for the standby power specification online for the Magnum Energy MS4024 and I found one specifications list that listed a No Load rating of 7 Watts. Even if the standby power draw is a bit higher with the remote meter, it shouldn’t consume anywhere near 100 Watts ?!? I wonder if you left something else On.
I like the small battery meter. Where can I find one of those?
Hi Marc!
It wasn’t clear in my original text, but the 100 watts included the fridge that was already on. The inverter added 30 watts. Like you mentioned, this includes standby power draw like the microwave and whatever other small AC items I might not be thinking about at the moment. I updated the post to clarify, hope it makes better sense now.
We purchased the battery meter from Amazon:
https://www.amazon.com/Multifunction-Battery-Monitor-Multimeter-Voltmeter/dp/B07T8GN61Z
John also wanted to mention that he has gotten a ton of good solar RV info from the following site:
https://www.mobile-solarpower.com/
Thank you!
-Marcy
Thank You John and Marcy for the Amazon link for the Battery Meter. I am familiar with Will Prowse’s web site http://www.mobile-solarpower.com , I have watched many of his YouTube videos. I trust his reviews – he’s not really trying sell you the gear he reviews, just his books. He lives in Las Vegas now where he just bought a house and a new Tesla Model 3. He must be doing well…
Thanks.