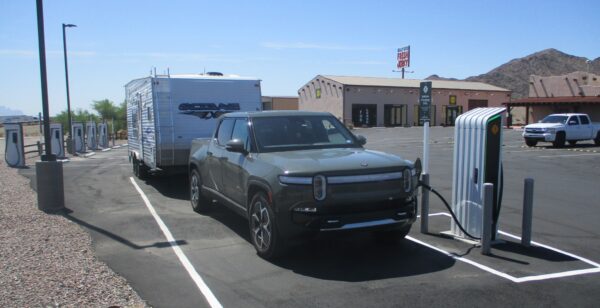
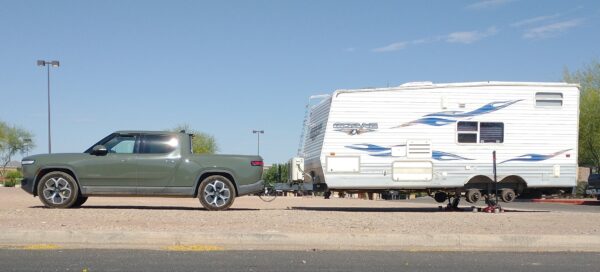
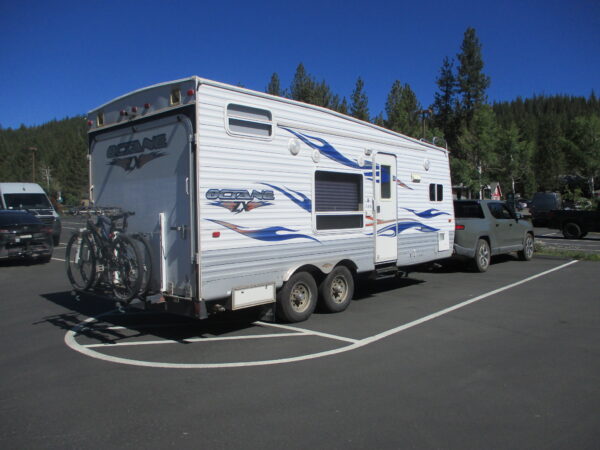
The summer of 2023 was another successful electric truck/towing/travel adventure. We journeyed to Wyoming again, continued on to explore southern Idaho and a bit of Nevada, then spent some time in the California Sierra Mountains. Building on our experiences from 2022, we had an easier time planning and the driving was more enjoyable with less stress.
It helps that the EV charging network is getting better all the time. Most notable is the addition of the Rivian Adventure Network (RAN). They are building charging stations in much-needed locations, and those stations are easy to use. Truly Plug-and-Play, we appreciate that every time. For a while we even got free charging. Best of all, most of the RAN locations have a pull-through spot, or at least room for parking while staying hooked up. Someone is listening!
Between the Rivian charger map and the PlugShare app, I can plan our travel days and target the longer “charger desert” stretches that require staying at an RV park in the middle. We’re still at the stage of needing RV parks (when towing) to reach some of the places we want to go. But again, things are improving and hopefully many “coming soon” charging stations noted on the maps are indeed coming soon.
The goal of this blog post is to review the data I collected over the past two summers. Specifically, to try to better understand how towing our travel trailer affects the truck’s range and what might cause that to vary in different situations. Ideally I could accurately predict how far we can drive in between charging stops.
First though, a few pictures from our 2023 summer tour.
Getting new tires on Howie before the start of the trip:
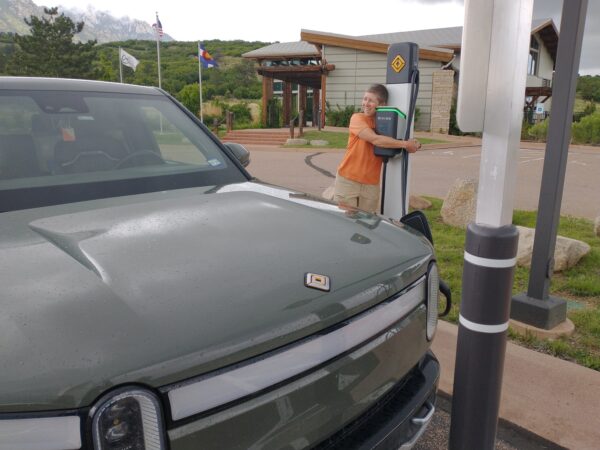
Appreciation for the Rivian charging network in Colorado Springs (this one is a level 2, medium speed charger at a state park):
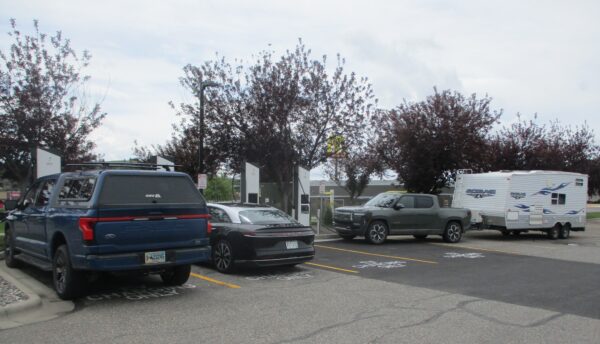
Electrify America chargers (in this case in Montana), where we very-occasionally have the chance to pull in from the side so we don’t have to unhook:
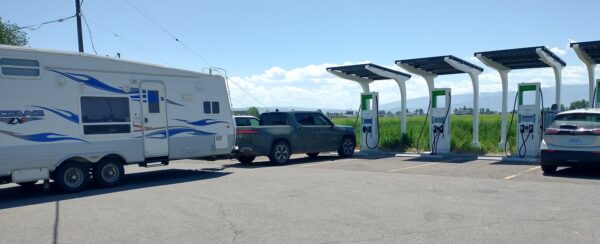
Cute little solar covers for some chargers in Idaho. At least you get a bit of protection from the weather while plugging in. How about eventually covering the whole area, like, you know, a gas station?
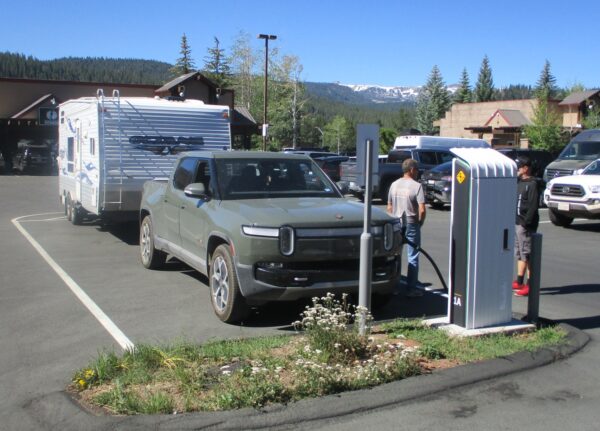
We used the Rivian chargers in Truckee several times. The trailer parking isn’t pull-through, and sometimes delivery trucks ICE it in (i.e. park there when they aren’t supposed to). “ICE” stands for internal combustion engine. This RAN charging station is still better than any Electrify America experience ever. It also has a lovely background. Occasionally you even get people to talk to about towing with an EV.
Next, an overview of the data.
We used our Rivian (Tug-E) to tow for 3619 miles in 2022 and 3877 miles in 2023. That’s a total of almost 7500 miles. Our current odometer is over 51,000 – which seems like a lot for 22+ months of ownership! We are putting this truck to the test, for sure.
For each leg of our towing journeys (in between charges), I record the following data:
– Start/end locations
– Distance
– Average speed (as calculated by the truck)
– Travel time
– Efficiency, which is miles per kilowatt-hour (kWh)
– kWh used (for reference, our battery holds 135 kWh)
– Outside temperature
– Wind speed and direction
– Elevation – start, min or max if there’s a hill or valley in the middle, and end
– State of charge (SOC) at the start and end
– Any notes like heater/AC on, precipitation, windows open, rolling hills, etc.
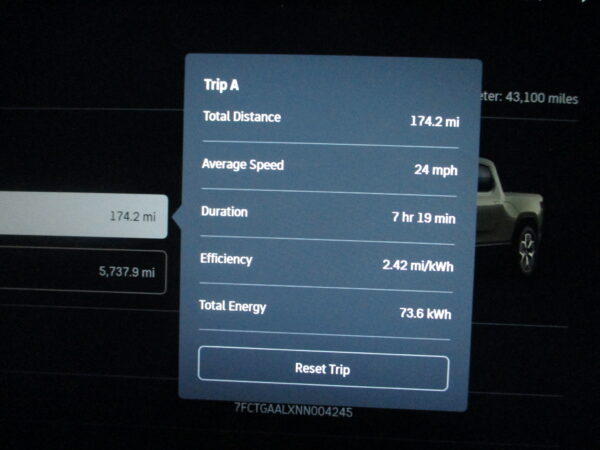
Tug-E provides some of the data with the trip odometers. I just have to remember to reset one of them at the beginning of each towing leg. This is an example odometer screenshot for several days of non-towing driving around Tucson.
The weather info comes from an app on my phone. I get elevation data from the Gaia app. State of charge (SOC) is a readout on the driver display that I need to remember to record before we plug in to recharge. Some email summaries from charging sessions include the start/end SOC, but not always. Watching all these numbers keeps me busy, so it’s a good thing John likes to drive.
A note on “efficiency” – it’s a good indicator of truck range, like gas mileage. When we’re not towing, Tug-E’s efficiency is typically over 2 miles per kWh. With a 135 kWh battery, that means we should be able to drive at least 270 miles between charging. Depending on conditions, we could get over 300 miles.
In real life, we almost never push it that far. The benefit of 300 miles of range is the flexibility in travel planning and lack of stress about charging. My personal opinion is that an EV with at least ~240 miles of range will get you almost everywhere you might ever want to go. Unless you spend lots of time in the backcountry.
Most electric cars are more efficient (some much more) compared to electric trucks. Lighter vehicle weight and aerodynamics work to their advantage, so the battery pack can be smaller and/or the range higher. If we didn’t need the towing capacity of the truck, we’d likely still be driving our Chevy Bolt (love that car, by the way). Our Bolt’s efficiency was in the 3 to 4 range.
Back to the Rivian, the efficiency while towing is about 1 mile per kWh. I’ve charted efficiency to compare towing and non-towing on the Progress/Status page of this website. The average is quite consistent. What’s missing from the chart is the variation from leg-to-leg. That’s what I’d like to analyze next.
As we gain experience in towing with Tug-E, we have a general sense of which factors most affect efficiency (reducing or increasing range). The top two are probably elevation changes and driving speed.
I suspect that every downhill somewhat compensates for a similar uphill. When we start at 5000 feet elevation, go up and over a 6500-foot pass and return to 5000 feet, energy usage won’t be too much more than a flat trip staying at 5000 feet. That’s the beauty of regenerative braking. The truck regains some of the energy used. How much? I don’t have the data to answer that, although I suspect someone at Rivian might.
Driving speed is the interesting factor. It’s almost completely within our control and we can adjust it as we travel. I like to watch the gauges, make predictions, and give feedback to John on our progress. Hopefully not too much feedback – I don’t want to “over-control” the system (or the husband!)
Smaller effects probably include wind, temperature, AC/heat, windows open/closed, and precipitation. These are more variable as well throughout the drive. So I don’t expect them to show up as strong factors.
Let’s see how I did!
And feel free to skip to the conclusions at the bottom if you don’t want to wade through all this stuff.
The following data is from two summers of towing, from Arizona to New Mexico, Colorado, Wyoming, Montana, Idaho, Utah, California, and Nevada.
Total distance towing was almost 7500 miles. Total energy used was 6685 kWh, for an average efficiency of 1.12 miles per kWh.
I’ve had some statistical training and experience, but it has been a while. The concepts are useful in day-to-day life. The details tend to get buried in the back of my brain. So feel free to correct anything that isn’t quite right and to suggest better ways of looking at the data.
At work I had access to a useful statistical program called JMP. In the outside world, the best I’ve found (so far) is the Orange app. Again, any suggestions for other tools to try would be appreciated.
First, an explanation of the numbers R and R-squared:
R = correlation coefficient; a number between -1 and 1, where 0 indicates no correlation and 1 (or -1) is a perfect correlation. R is positive if the data trends upward and negative if downward. The graphs below show the R-value on the regression line.
R-squared = the square of the R-value, also called the “goodness of fit”. This indicates how much of the efficiency can be predicted by the input variable, or what % of the variability can be accounted for (vs. other factors that aren’t included in the model)
Two outliers of note (which I included in some graphs but not others):
1) The first was driving from Silverton to Montrose, CO. This is an interesting route that includes the Million Dollar Highway. It helps to have seen it a few times in the past before deciding to tow a travel trailer on it.
From Silverton, it’s a somewhat gentle 1800-foot climb up to a pass. Then some slow switchbacks, a bit of a break across the prairie, followed by the “airy” section and then more switchbacks down to Ouray. Finally a mostly-downhill ride north to Montrose. Needless to say, we took it slow and careful. A 5000-foot descent will do wonders for an EV’s efficiency, which ended up at 2.21.
2) The second outlier was from French Camp to Bishop, CA. We drove only 25 miles and it was all downhill (3000 feet of downhill). You can’t get much easier than that. It was not surprising to see an efficiency of 2.76.
Let’s look at the graphs.
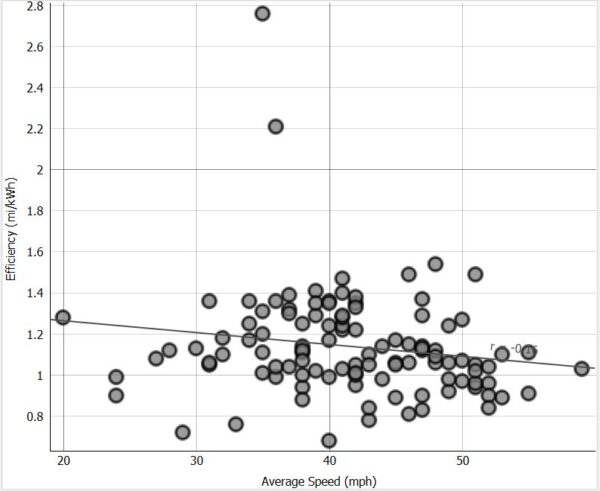
Efficiency vs. speed:
There is surprisingly no obvious correlation to average speed. This is counter to what we thought we knew about the effect of speed, especially when towing a large boxy shape.
R-squared = 0.03 (essentially no correlation)
In real-life situations, we can clearly see the effects of speed while we’re driving. If range starts to be a question, we slow down and the truck calculations show that we can drive farther. When it’s clear that we have plenty of battery, we can speed up and watch the range drop.
I wonder if Rivian’s AVS (average speed) calculation is using “driving time” that includes stopping for lights, pausing for turns, etc.? I could imagine a trip that begins with 5 miles of city driving (say 30 mph) and 20 minutes stopped at the lights. Then we get on the highway and drive 60 mph for 60 miles. Total drive time is 90 minutes over 65 miles, for an average speed of 43 mph. If we spent only 5 minutes stopped at the lights, the average speed increases to 52 mph. And yet sitting at traffic lights should have no effect on efficiency. So the AVS data isn’t really what I should be using to look at speed.
We will need to focus on this question. I can try to figure out what is included in “driving time” and whether AVS is a good indicator of actual speed while actually driving. Perhaps I need to add another factor to my data collection to get a better sense of speed (like watching the speedometer, which is more subjective) in order to look for a stronger correlation to efficiency.
Also, a controlled test on a highway could be useful. If the conditions didn’t vary much (flat, similar wind and temperature), we could drive at one speed for a while and compare results to another section driving at a different speed.
It’s highly likely there is a correlation between speed and efficiency. I just need to figure out how to measure it.
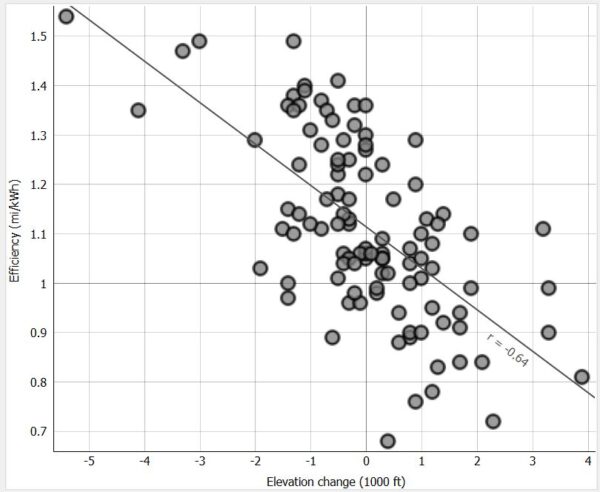
Elevation change:
This chart is much closer to my expectations. Elevation drops (downhill driving, which are negative numbers) resulted in higher efficiency. Elevation increases (going uphill, positive numbers) required more energy and reduced efficiency.
Especially when removing the two outliers, the graph clearly shows this trend.
To make the numbers easier to follow, I divided the elevation by 1000, so it’s “efficiency change for every 1000 feet of climb/descent”
R-squared = 0.41, meaning 41% of the variation in the data can be explained by elevation changes while driving.
Slope = -0.08
This indicates that for every 1000 feet of climb, the efficiency drops by about 0.08
When it’s flat, the efficiency is around 1.12 miles/kWh
Going uphill by 1000 feet in elevation drops the efficiency (on average) to 1.04 mi/kWh
And downhill 1000 feet improves efficiency to ~1.20 mi/kWh
I’m sure there is more nuance involved (like steepness and distance) but I’m going to leave those weeds alone for now.
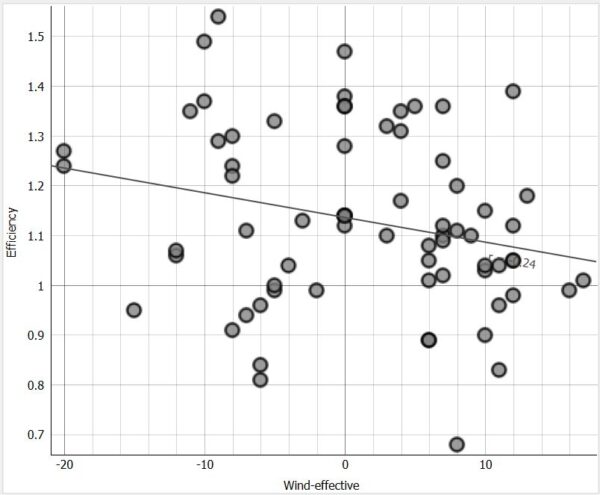
Wind:
I used positive numbers for a head wind and negative numbers for a tail wind. I left the side wind entries blank, as I’m not sure how to deal with angles (vectors) in this analysis.
The graph does not show a strong correlation between wind and efficiency (R-squared is 0.06). Probably because there are so many other variables. A controlled experiment would be better, except we don’t have a wind tunnel at our disposal.
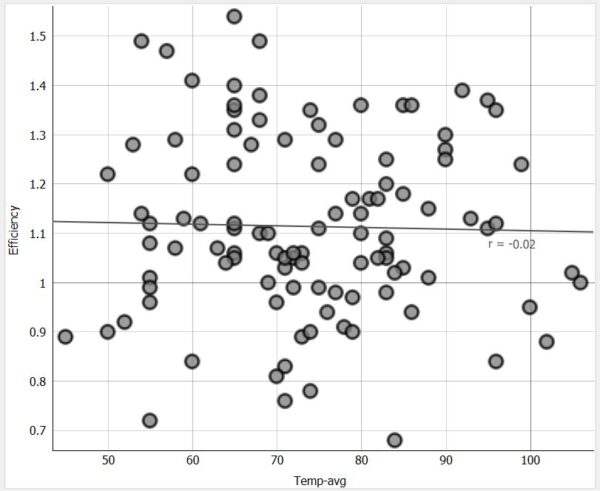
Temperature:
I don’t see a correlation between temperature and efficiency, and R-squared (effectively zero) agrees. Our lowest temperatures didn’t approach freezing, which is when EV’s take a hit in range, otherwise we would likely see a drop-off on the lower end of the graph.
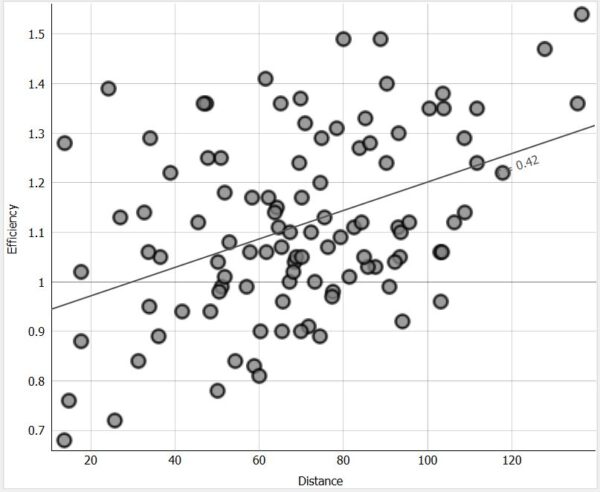
Distance traveled:
Because I have the information already, I threw the “distance traveled” onto a graph. I am surprised to see something of a trend, where the efficiency improves as we drive further at a stretch.
R-squared = 0.18, so perhaps 18% of the variation can be attributed to distance traveled.
We suspect that it relates to the travel planning; if we know we’re going uphill the whole way, we won’t attempt to make it as far in between charging. And/or we will drive more slowly to improve efficiency. As noted above, this does work, regardless of what the speed chart suggests.
Perhaps there is also some kind of warm-up period at the beginning of a drive. Or the extra energy needed to get up to speed (especially pulling a travel trailer) is more significant than I would have guessed. This sounds like a factor that could be experimented with in a more controlled way.
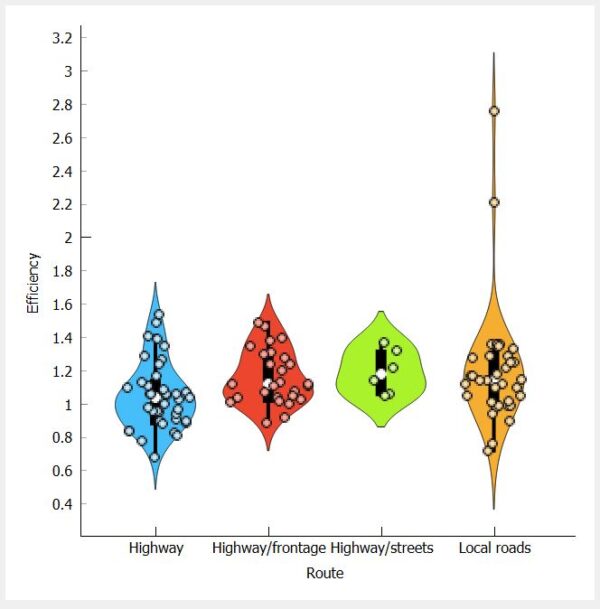
Type of route:
When towing, we like to travel on local and frontage roads when possible because we can drive at a slower speed compared to the highway. This tends to be the less stressful and more enjoyable option.
Per the data plots, each type of route shows a range of efficiencies and no clear winner. The two high-efficiency outliers were both on local roads, but otherwise there is no obvious correlation.
Other factors:
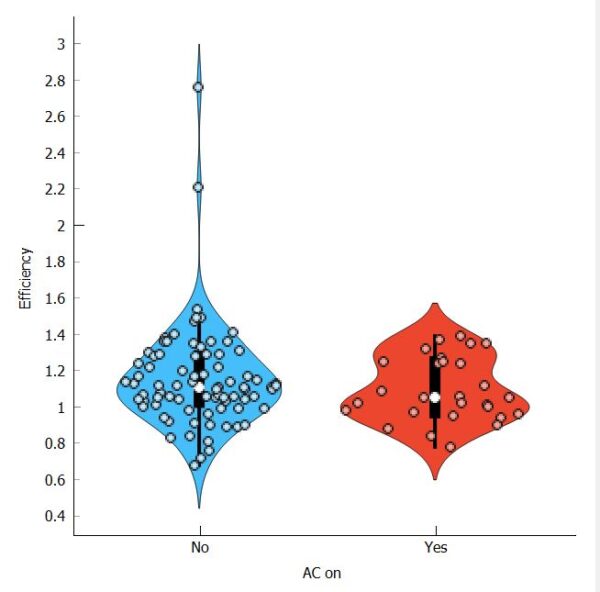
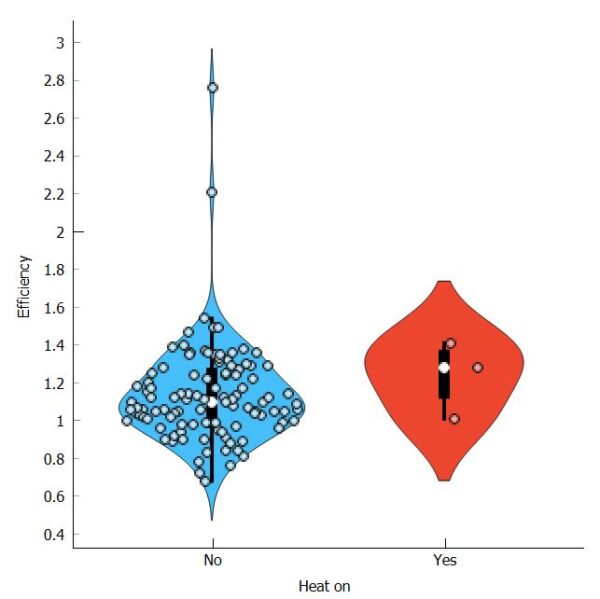
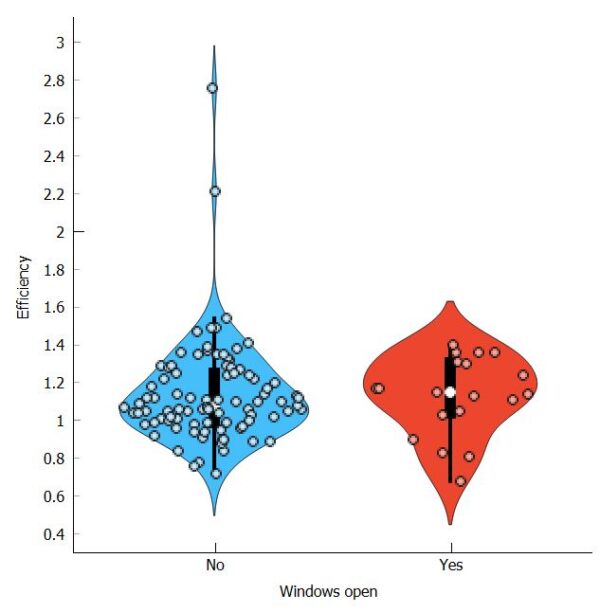
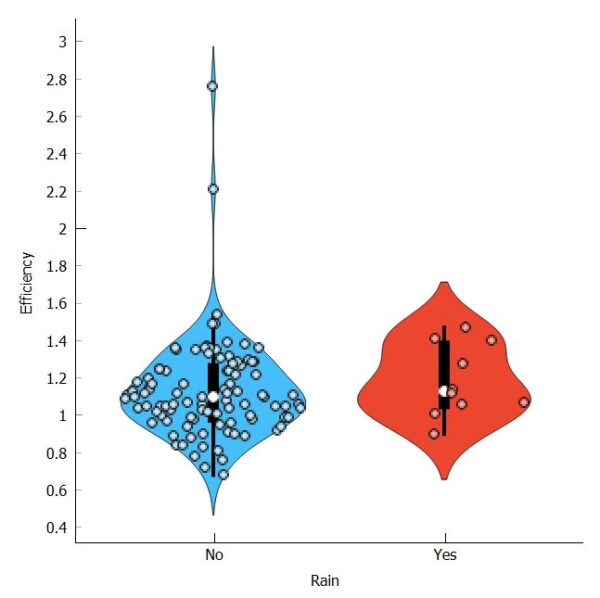
There is no obvious correlation to having climate control on or off, having the windows open, or driving in rain. There is surely some small effect to using more energy (heating/cooling), but in these uncontrolled situations it’s impossible to tease it out of the large variation.
Air conditioning:
Windows open:
Rain:
It would be nice to run some controlled experiments (keeping other variables constant as much as feasible). I could see doing this with the truck by itself, but not while towing. It’s enough effort and disruption to move our home in order to travel; I cannot envision doing that just for better data.
So I’ll continue to collect what towing information I can as we travel, knowing the limitations.
Summary:
Speed as currently measured (total distance divided by total drive time) does not show a correlation to truck efficiency while towing. This is counter to what we think we know. I will work on improving the data to use actual driving speed and ignore pauses like waiting at traffic lights. Perhaps that way I can improve the model.
Overall elevation gain/loss has an obvious effect on truck efficiency. I will ponder how we might figure out the amount of energy the truck battery regains during descents vs. how much extra it uses on uphills.
Surprisingly, longer distance traveled has some correlation to efficiency. I suspect that is due to our travel planning (only driving further when the terrain is not challenging) and driving style (slowing down and staying off the highways when possible, if we have a longer leg ahead of us).
But perhaps there is more to it, and maybe the truck efficiency really does improve the longer we drive? Stay tuned on that question.
Other factors seem to be buried in the noise, including wind, temperature, AC or heater on, windows open, rain, and type of route.
We have more towing planned for this summer and we’re looking forward to seeing more of the country (and collecting more data)!
